How do you work with .ab1 files?
Results of DNA sequencing are provided in three data files – .ab1 file, .seq file and .phd.1 file.
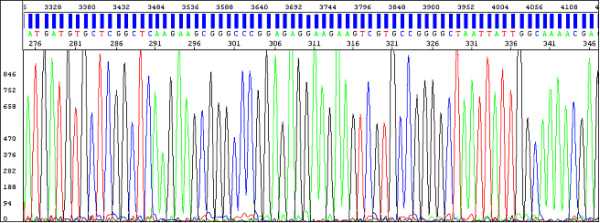
- .ab1 file contains the DNA sequence electropherogram as well as raw data and some other information. You always receive it processed from us, where processed means examined by a basecalling program. There are various basecalling algorithms available and we always try and choose the one which gives best results. The electropherogram is also saved and provided as a .jpg file but we recommend to use .jpg file for a quick check only and use .ab1 for a thorough data interpretation (including Raw data) instead.
- .seq file is a simple sequence text file in FASTA format.
- .phd.1 file (Phred file) is a simple text file containing bases with quality values for each base.
Both .seq and .phd.1 you can easily open and examine in any text editor of your choice.
Electropherogram (data after analysis) shows a sequence of peaks in four colors, each color represents the base called for that peak and there is a textual version of recorded sequence visible:

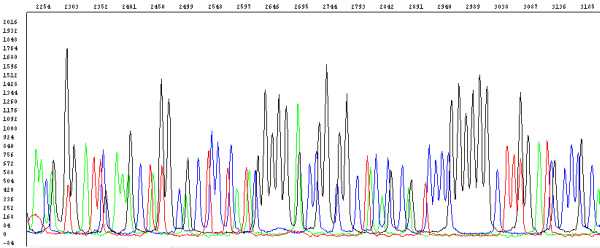
Raw data (data before analysis by the basecaller algorithm) are data as they are recorded by the sequencer:

How do we manipulate results before sending them out?
What we get first from our DNA sequencers is the raw data. These are analyzed using special algorithms dedicated for this purpose and called basecallers. As a result we get the electropherogram, provided to you as a part of .ab1 file, and read the sequence, saved again in .ab1 file but also in .seq and .phd.1 files (see above). Every electropherogram is then checked.
We also choose how to visualize electropherograms. There are in principle two options only – True or Flat profile. While the Flat profile displays the data as processed traces scaled semi-locally, the True profile displays data as processed traces scaled uniformly and is very similar to that of the raw traces which is not suitable for samples with declining peak intensities. In any case these profiles are only two ways of showing the same thing, the data – sequence and quality values (see below) are not changed in any way.
Note: Since January 2015 when we enabled download of results also in jpg files we use Flat profile only.
Data analysis software
To perform data analysis you need software to open .ab1 files. There are many different programs available, some free, and it is not easy to give recommendations as to which software you should choose. In general, you should always use software which not only shows the electropherogram but also the raw sequence data since these are critically important if the quality is low and you need to know why.
Amongst the free software tools FinchTV and Sequence Scanner are probably the most popular ones. They enable viewing and editing .ab1 files and evaluating their quality but typically only one-by-one. In case you need to perform analysis on a more sophisticated level, for example you wish to perform assembly of multiple sequences, comparison to a reference sequence, automatic mutation detection etc., you need special software packages like Sequencher (GeneCodes) or SeqScape (Applied Biosystems). We can provide training for them if you are interested.
Data analysis
When evaluating .ab1 files, you should first see the electropherogram and come to a conclusion whether your data can be considered of good quality or not.
Good quality sequencing data are characterized by:
- well-defined peak resolution (bad resolution of the first 10-25 bases is acceptable)
- uniform peak spacing
- high signal-to-noise ratios
An example of a very good quality data:

A quick and very comfortable way to check the data quality is Quality Values (QVs). By definition the QV is a per-base estimate of the basecaller accuracy. In a plain language, QVs are colored bars above peaks/bases:

Quality values in data files you receive from us follow these rules:
- Blue bars are good bars. Blue = high quality pure bases, QV>20. The algorithm is at least 99% sure of reading the base right. Bases with QVs>20 can still be read incorrectly, it is just not that likely.
- Yellow and red (worse then yellow) bars mean uncertainty of the basecalling algorithm, QV<20. Bases with QVs<20 can still be read correctly, it is just not that certain.
If your .ab1 file looks like on the picture above then you only need to read its sequence and eventually perform some manual edits at the very beginning/end of it (where there are also yellow and red bars shown).
If, however, you do not see such a pretty picture then you need to troubleshoot your data to understand what failed and why and take corrective measures in the future. These can vary dramatically depending on the nature of the problem and usually you need to examine especially raw data very carefully. Contact us for advice to specific issues you observe in your data.